bioparticle

a PFLOTRAN reaction sandbox for particle transport
One-site kinetic attachment of Phage PRD1
What is this experiment?
Column experiment for the transport (adsorption/decay) of a non-enveloped virus in a saturated porous media.
What does the code do?
runTableCases.py recieves a csv-file with the list of cases to be executed and a template file for the input PFLOTRAN. The template has tags where values will be replaced by the ones indicated in the csv-file. For example, in the template file
  REACTION_SANDBOX
    BIOPARTICLE
      RATE_ATTACHMENT <katt> 1/h
    /
  /
the tag <katt> is replaced for the list of values indicated in the csv-file, in the column with the same header.
How to run this test?
python3 runTableCases.py [CSV_PARAMETERS] [TEMPLATE_FILE] -run
More details of the real experiment:
Sadeghi, G., Schijven, J.F., Behrends, T., Hassanizadeh, S.M., Gerritse, J. and Kleingeld, P.J. (2011), Systematic Study of Effects of pH and Ionic Strength on >Attachment of Phage PRD1. Groundwater, 49: 12-19.
Description
An injection of an infective virus (PRD1) at a given concentration is set at the inlet of a column experiment. The virus can either attach to the quartz matrix, dettach and re-enter the aqueous phase, and decay and lose infectivity. After some time, the bioparticle injection is stopped and only clean water keeps runing through the column.
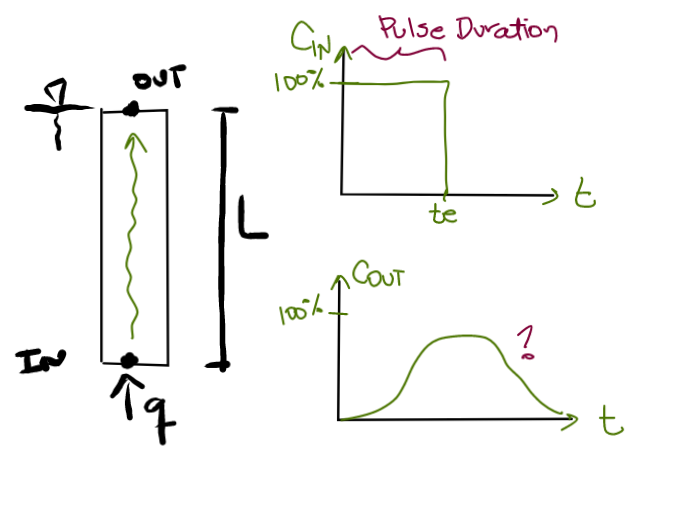
| Column parameters | Value | Unit | |
|---|---|---|---|
| Lenght | L | 50 | cm |
| Diameter | Ø | 5 | cm |
| Grain size | d50 | 0.44 | mm |
| Darcy velocity | q | f(Case) |
cm/h |
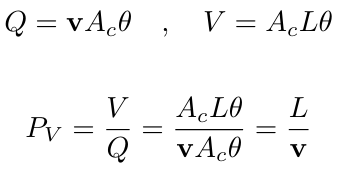
| Liquid velocity | v | = q × θ | cm/h |
| Pore Volume | PV | = L / v | s |
| Pulse Duration | te | f(Case) |
s |
| Particle parameters | Value | Unit | |
|---|---|---|---|
| Size | dp | 62 | nm |
| Initial concentration | C0 | 1.66 × 10⁻¹⁶ | mol/L |
| Long. dispersion | αL | 0.2 | cm |
List of parameters
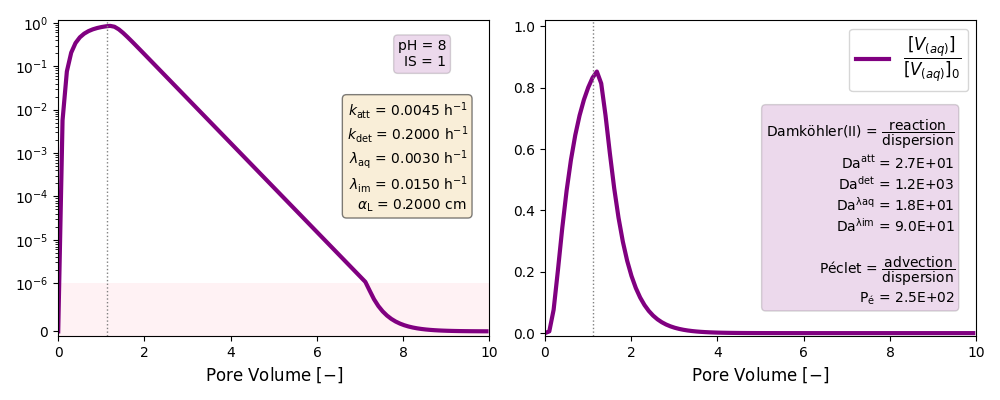
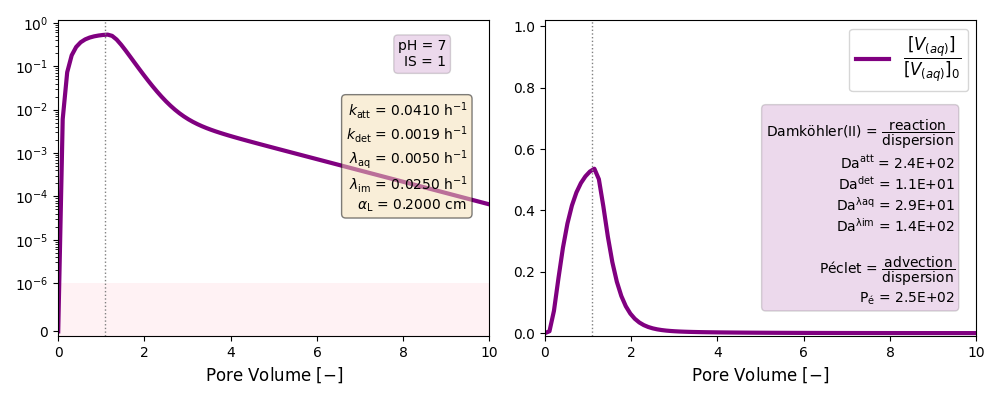
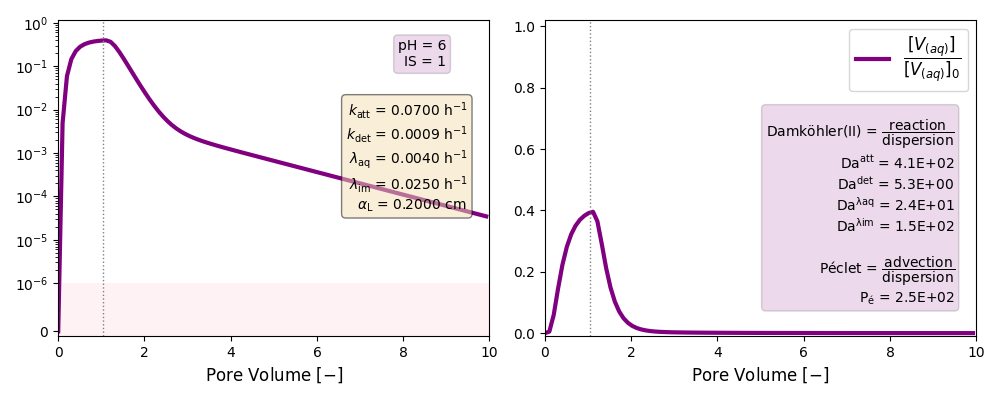
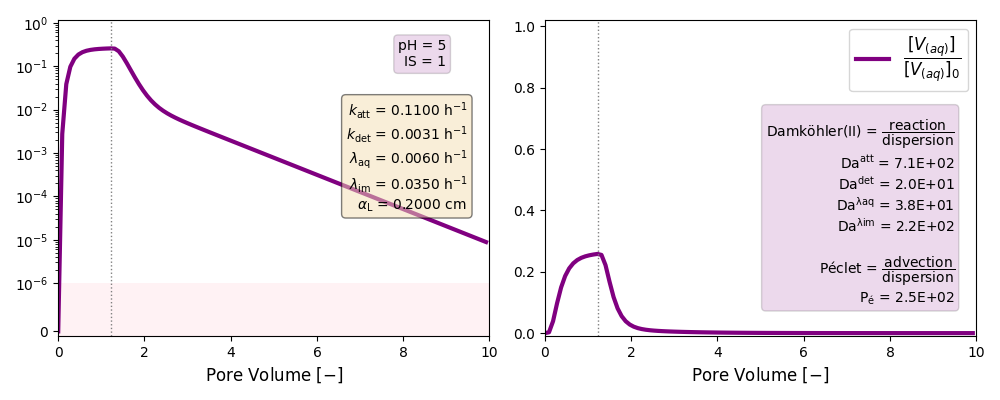
| IS | pH | Folder | katt | kdet | λaq | λim |
| 1 | 8 | ./CASE_001 |
0.0045 | 0.2000 | 0.003 | 0.015 |
| 7 | ./CASE_002 |
0.0410 | 0.0019 | 0.005 | 0.025 | |
| 6 | ./CASE_003 |
0.0700 | 0.0009 | 0.004 | 0.025 | |
| 5 | ./CASE_004 |
0.1100 | 0.0031 | 0.006 | 0.035 | |
| 10 | 8 | ./CASE_005 |
0.0380 | 0.0036 | 0.007 | 0.040 |
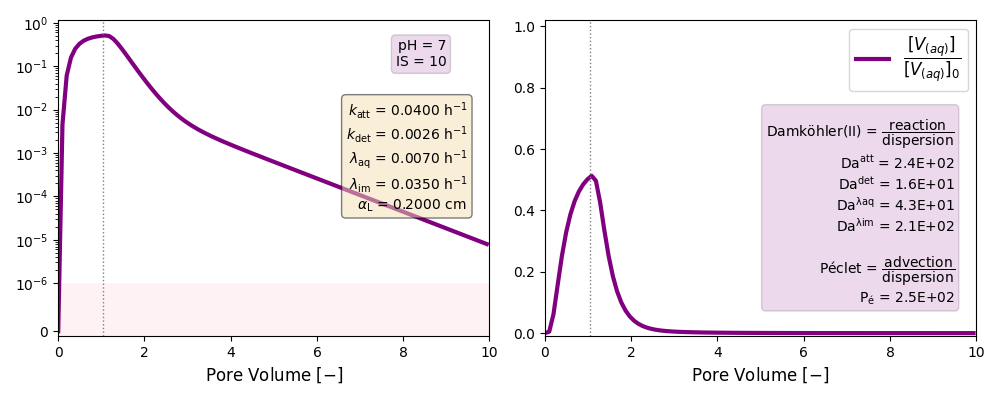
| 7 | ./CASE_006 |
0.0400 | 0.0026 | 0.007 | 0.035 | |
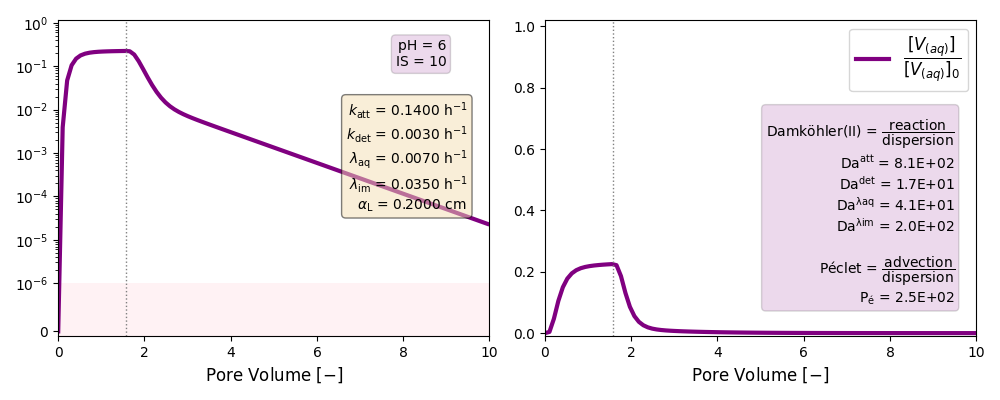
| 6 | ./CASE_007 |
0.1400 | 0.0030 | 0.007 | 0.035 | |
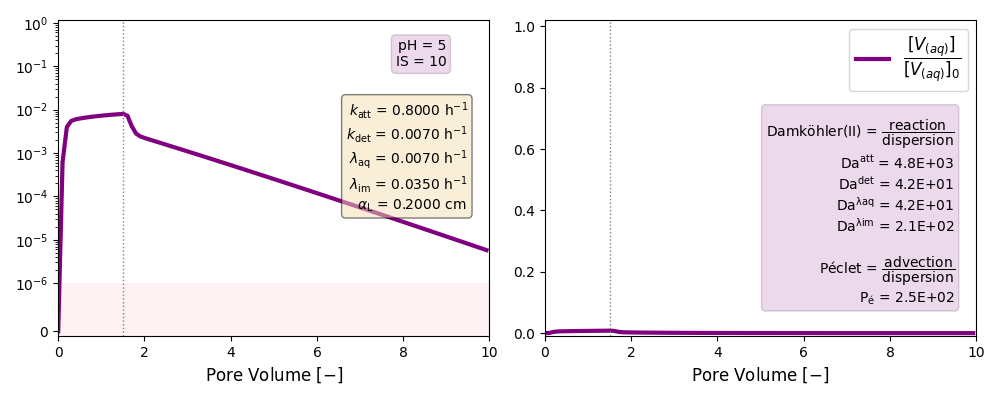
| 5 | ./CASE_008 |
0.8000 | 0.0070 | 0.007 | 0.035 | |
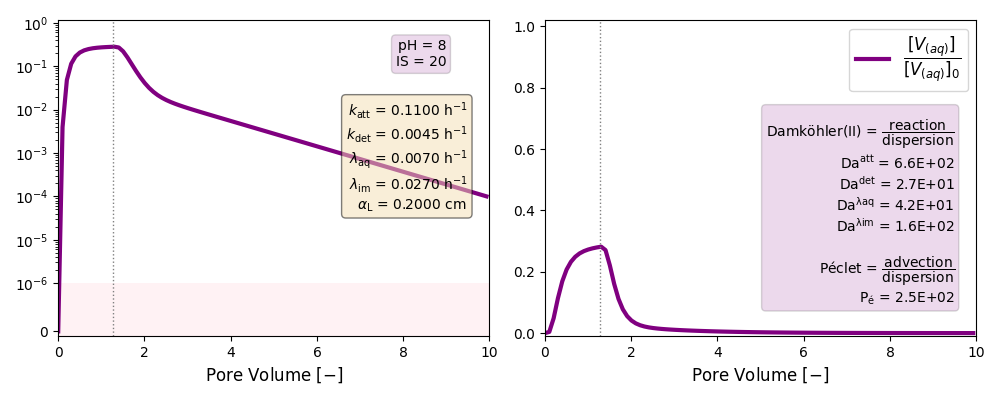
| 20 | 8 | ./CASE_009 |
0.1100 | 0.0045 | 0.007 | 0.027 |
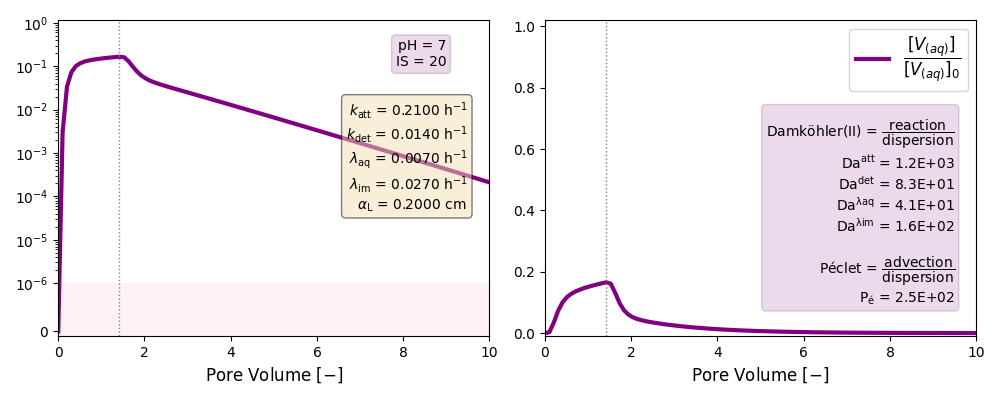
| 7 | ./CASE_010 |
0.2100 | 0.0140 | 0.007 | 0.027 | |
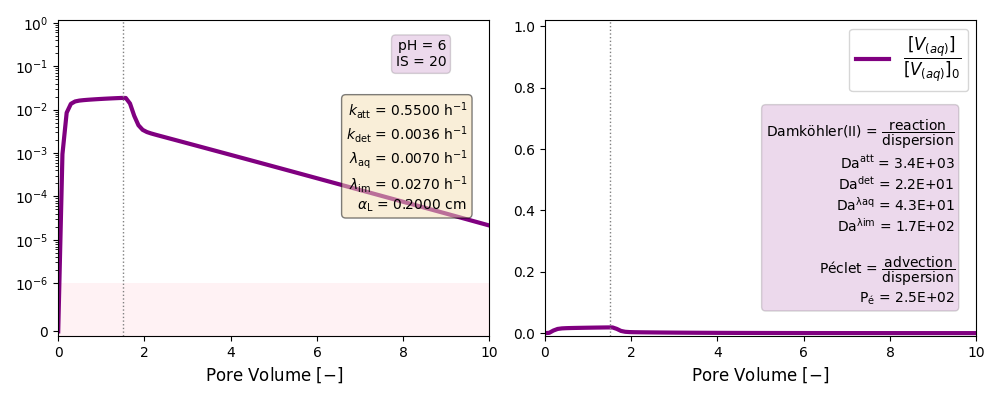
| 6 | ./CASE_011 |
0.5500 | 0.0036 | 0.007 | 0.027 | |
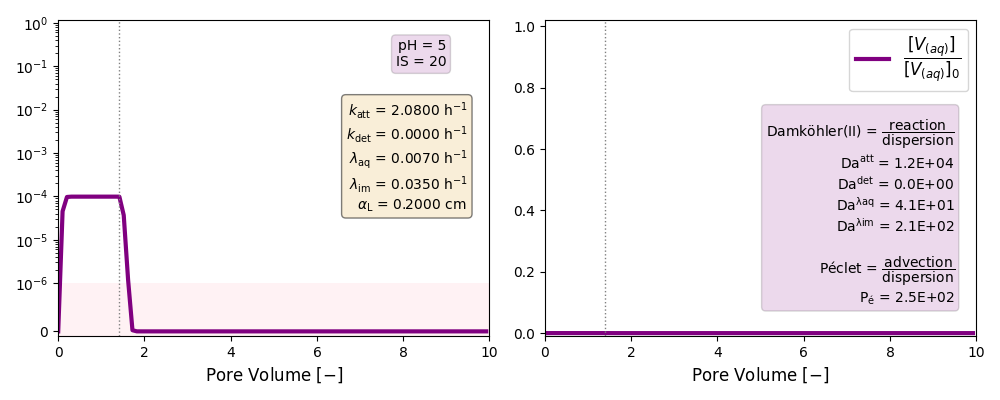
| 5 | ./CASE_012 |
2.0800 | 0.0000 | 0.007 | 0.035 |
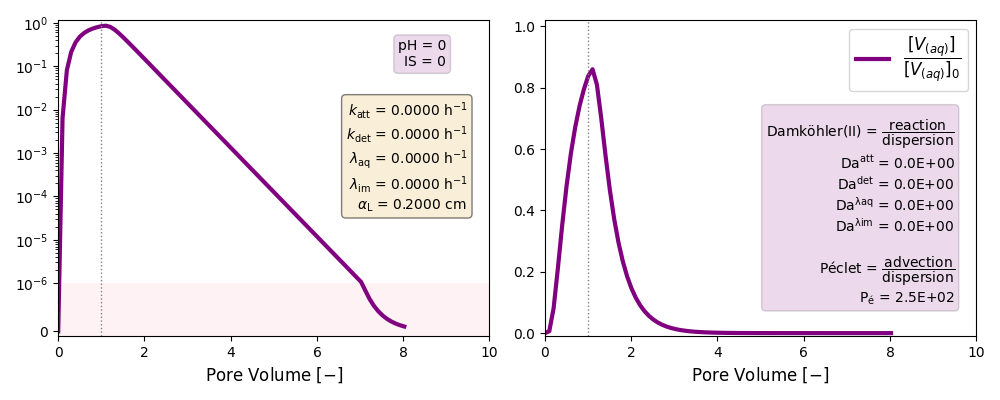
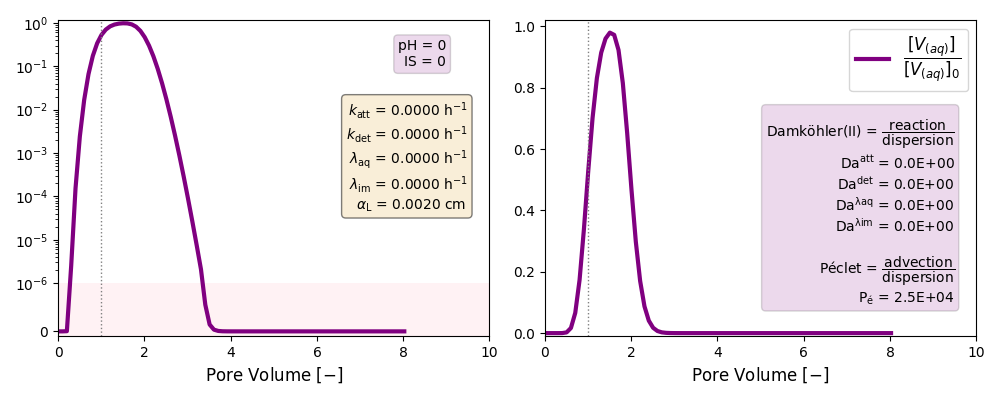
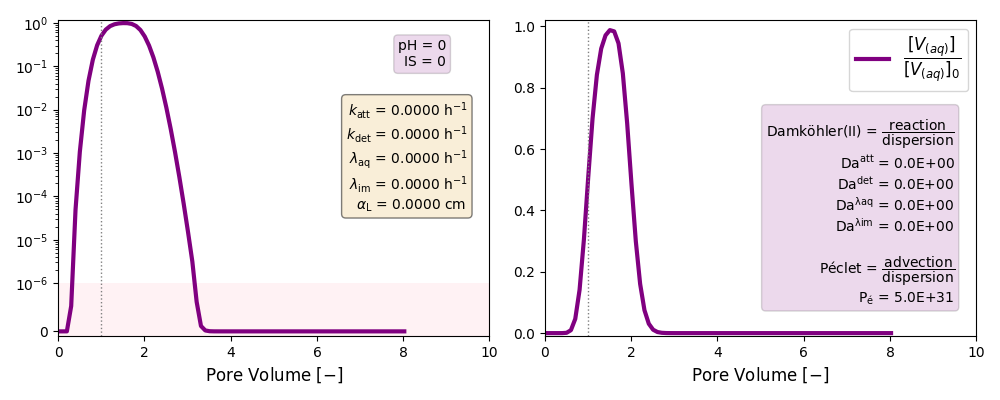
Other cases with no reaction terms are run to ilustrate the effect of a high longitudinal dispersion coefficient in the tail of these plots and the soon arrival of the peak of the curves.
| Case | Long. Disp | Folder | katt | kdet | λaq | λim |
| Low Péclet | αL= 0.2 cm | ./CASE_013 |
0 | 0 | 0 | 0 |
| "Reasonable" Péclet | αL= 0.002 cm | ./CASE_014 |
0 | 0 | 0 | 0 |
| Péclet → ∞ | αL= 1 × 10-30 | ./CASE_015 |
0 | 0 | 0 | 0 |
k and λ units in [h-1]
PFLOTRAN Simulation
Without the attachment/detachment and decay rates
Low Péclet number:
“Reasonable” Péclet number:
Péclet → ∞ :
With the attachment/detachment and decay rates